The monthly distribution of $9$ Watt LED bulbs sold by two firms $X$ and $Y$ from January to June $2018$ is shown in the pie-chart and the corresponding table. If the total number of LED bulbs sold by the two firms during April-June $2018$ is $50000$, then the number of LED bulbs sold by the firm $Y$ during April-June $2018$ is ________.
Percentage of $9$ Watt LED bulbs sold by the firms $X$ and $Y$ from January $2018$ to June,$2018$
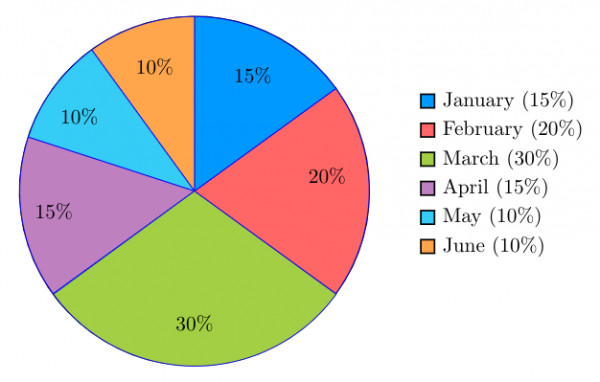
$$\begin{array}{|c|c|} \hline {} & \text{ Ratio of LED bulbs} \\ \text{Month} & \text{ sold by two firms} \\ & (X:Y) \\ \hline \text{January} & 7:8 \\ \hline \text{February} & 2:3 \\ \hline \text{March} & 2:1 \\ \hline \text{April} & 3:2 \\ \hline \text{May} & 1:4 \\ \hline \text{June} & 9:11 \\ \hline \end{array}$$
- $11250$
- $9750$
- $8750$
- $8250$