The queue length (in number of vehicles) versus time (in seconds) plot for an approach to a signalized intersection with the cycle length of $96$ seconds is shown in the figure (not drawn to scale)
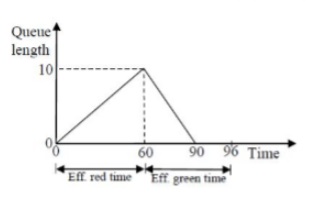
At time $t=0$, the light has just turned red. The effective green time is $36$ seconds, during which vehicles discharge at the saturation flow rate, $s$ (in vph). Vehicles arrive at a uniform rate, $v$, (in vph), throughout the cycle. Which of the following statements is TRUE?
- $v=600$ vph, and for this cycle, the average stopped delay per vehicle $=30$ seconds
- $s=1800$ vph, and for this cycle, the average stopped delay per vehicle $=28.125$ seconds
- $v=600$ vph, and for this cycle, the average stopped delay per vehicle $=45$ seconds
- $s=1200$ vph, and for this cycle, the average stopped delay per vehicle $=28.125$ seconds