In the figures, Group I represents the atmospheric temperature profiles (P, Q, R and S) and Group II represents dispersion of pollutants from a smoke stack $(1, 2, 3$ and $4)$. In the figures of Group I, the dashed line represents the dry adiabatic lapse rate, whereas the horizontal axis represents temperature and the vertical axis represents altitude.
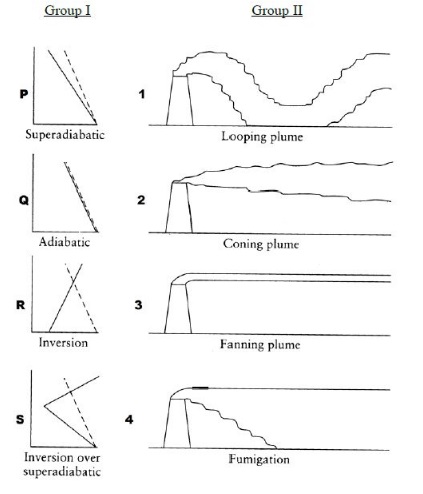
The correct match is
- $P-1, Q-2, R-3, S-4$
- $P-1, Q-2, R-4, S-3$
- $P-1, Q-4, R-3, S-2$
- $P-3, Q-1, R-2, S-4$
