The relationship between traffic flow rate (q) and density (D) is shown in the figure
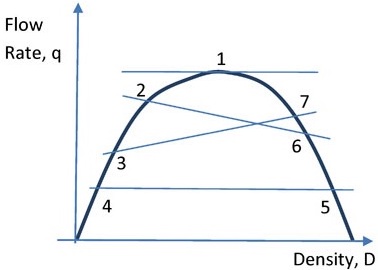
The shock wave condition is depicted by
- flow with respect to point $1\:(q_1=q_{max})$
- flow changing from point $2$ to point $6\:(q_2>q_6)$
- flow changing from point $3$ to point $7\:(q_3<q_7)$
- flow with respect to point $4$ and point $5\:(q_4=q_5)$